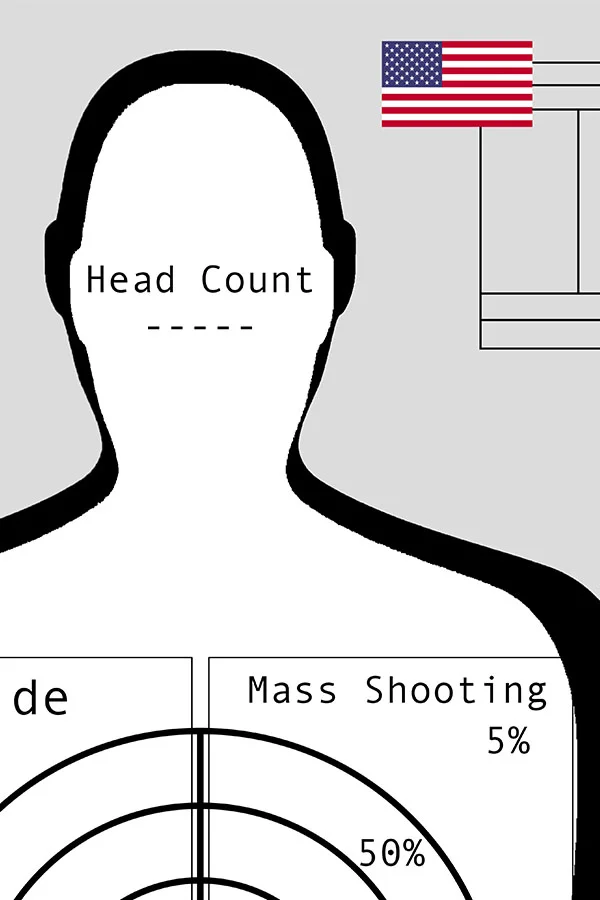
Different types of gun violence affect different demographics in very different ways.
Using P5.js I set out to create a data visualization piece that represented the relative proportions of types of gun deaths based on racial demographics within the United States.
The closer the bullet to the bullseye, the larger proportion that method of death by gun violence affects that demographic.
Wheatpaste display
Displayed in the New York University Interactive Media Arts semester end show 2019
var keyImg;
function preload() {
keyImg = loadImage('PDS final background KEY.png');
white = loadImage('whitecanvas.png');
black = loadImage('blackcanvas.png');
}
// var race = [ 0- population killed by guns, 1-suicide, 2-mass shooting, 3-police shooting, 4- homicide];
var white = [13377, 6821, 236, 466, 5854];
var black = [10032, 2712, 47, 234, 10039];
var bulletScale = 800;
//Proportions
var whSuicide = ((white[1] / white[0]) * bulletScale);
var whMass = ((white[2] / white[0]) * bulletScale);
var whPolice = ((white[3] / white[0]) * bulletScale);
var whHomicide = ((white[4] / white[0]) * bulletScale);
var blSuicide = ((black[1] / black[0]) * bulletScale);
var blMass = ((black[2] / black[0]) * bulletScale)
var blPolice = ((black[3] / black[0]) * bulletScale);
var blHomicide = ((black[4] / black[0]) * bulletScale);


